Extract, clean, analyze, and visualize real-world datasets using SQL, Python, and PowerBI. Designed for both tech graduates and analytical thinkers from math, stats, or commerce backgrounds.
Practical statistical analysis, querying, and corporate reporting.
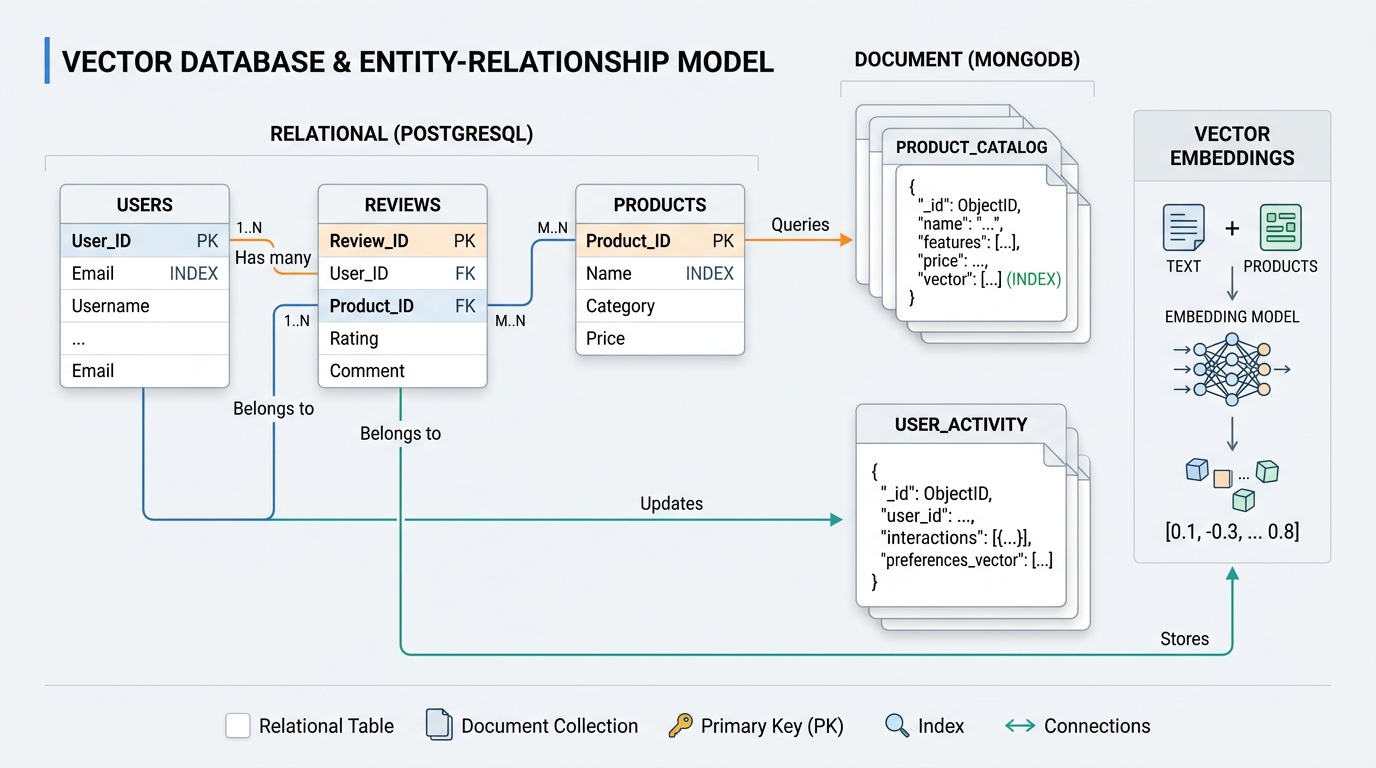
Complex joins, subqueries, window functions, and database schema navigation for business metrics.
NumPy, Pandas for data wrangling, Matplotlib and Seaborn for statistical exploratory data visualization.
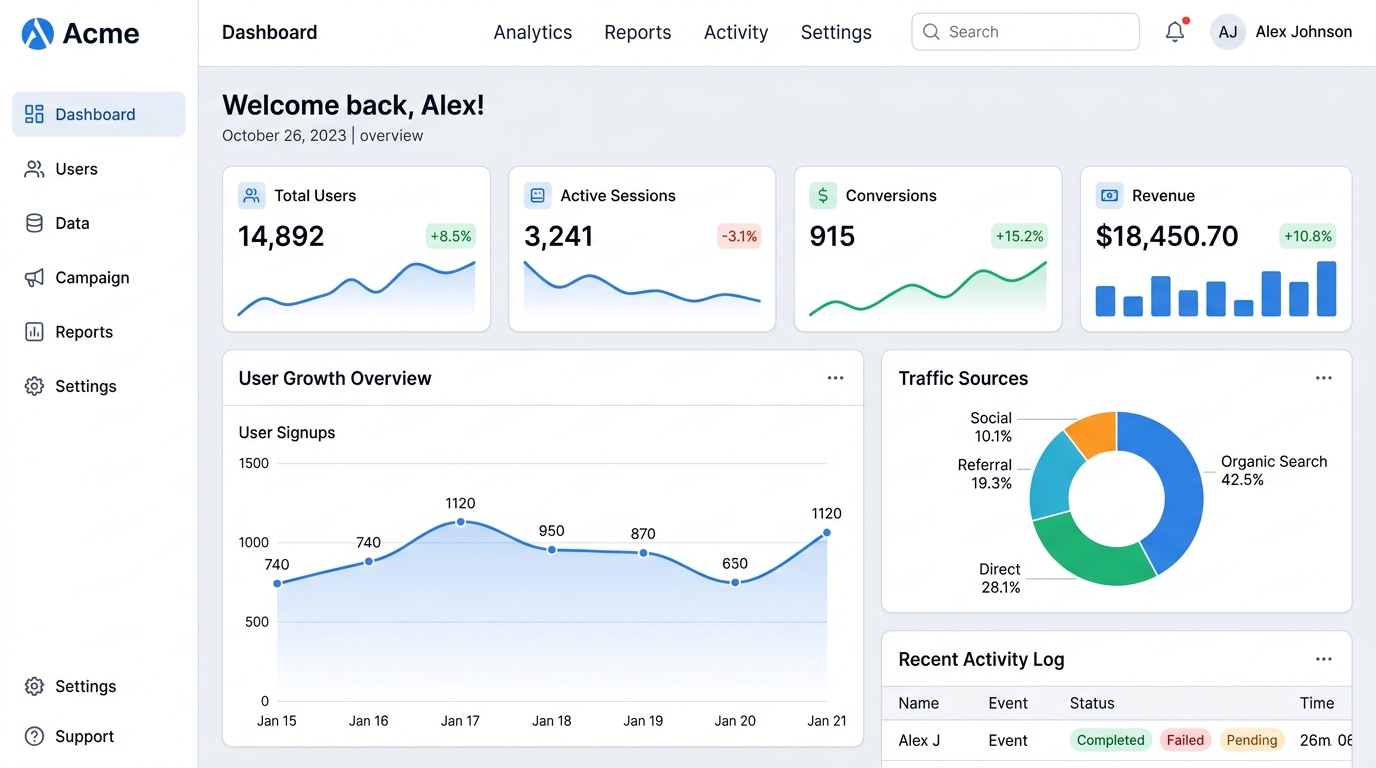
KPI metrics, interactive dashboards, DAX queries, and executive stakeholder storytelling.
Sit down with our data analytics mentor at M.P. Nagar, Bhopal to evaluate your math/analytical comfort and plan a realistic study schedule.
Schedule In-Person Counselling